Contour Maps
What is a contour map?
A contour map is a map marked with contour lines to show the shape of the land and its ruggedness. The contour lines are used to describe different landscape features such as hills, valleys, ridges, cliffs, gullies, or depressions. They are drawn on the map by connecting points of equal elevation (i.e. height in meters/feet, above sea level).
Why is a contour survey important in a construction project?
Before you start on the design of your building and develop the sites, it is necessary to carry out a contour survey to understand the structure of the site. The contour survey will indicate how, when it rains, water will flow across and through the property, where it will collect, and where it might wash away the soil. Drainage for the property can be planned accordingly. It will also indicate how much site work may be required to make the construction feasible depending on the type of foundation (Raised foundations and slab foundation homes, Pole Homes – Pros & Cons).

Figure 1 shows the contour map of a construction site. The contour map indicates that it is a sloping site – it needs to be levelled if one is using a slab foundation. The costs of removing soil and construction of retaining walls will need to be calculated. If you are using a raised foundation, the site structure (slope) will indicate the height of each support required for a levelled foundation. These costs need to be calculated depending on the contour survey data. Hence contour mapping is an essential tool in construction projects.
Characteristics of contour lines
The following are the general characteristics of contour lines (National Parks Association of NSW & Ordnance Survey, 2021):
- Contour lines do not cross each other. Each line represents a separate elevation, and a single point cannot have two different elevations.
- Contour lines that are spaced closely indicate a steep terrain. For very steep slopes, such as a cliff, the contour lines will be so close together and appear to touch.
- Contour lines that are spaced far apart indicate gentle slopes or flat areas.
- Contour lines in concentric circles represent hills, peaks, or mountains with the inside of the smallest circle being the top.
- A depression is represented by contour lines in concentric circles with small tick marks or hachures pointing towards lower elevation. The inner contour lines have a lower elevation than their outer surrounding.
- When contour lines cross a gully (a gully is a narrow valley, usually formed by a watercourse), they form a ‘V’ shape or a ‘U’ shape. The tip of the ‘V’ or closed end of the ‘U’ always points
- When contour lines cross a ridge, they form a ‘V’ shape or a ‘U’ shape with the tip of the ‘V’ or closed end of the ‘U’ always pointing downhill.
- Contour lines will not always be individually marked with their elevations. Usually, every 5th contour line is marked with their elevations. This is the index contour line and is generally darker than other contour lines.
- The elevation of unlabelled contour lines can be determined by counting the number of lines above or below the nearest index contour line, multiplying by the contour interval, and adding or subtracting the result from the nearest index contour line.
- Contour maps do not show every contour line, rather they choose a sample of the lines (for example every 5, 20, 50 or 200 metres) depending on the scale of the map. This is called the contour interval.
- The vertical distance between each contour line (the contour interval) is constant and is usually stated in the map legend.
- Usually, only the changes in the shape of the landscape that is equal to or greater than the contour interval will be shown on the map.
Figure 2 (a), (b), (c) show how contour lines represent landscape features on a map (VicPlan, Victoria State Government). The different land surfaces are denoted by the following: 1 – Hill, 2 – Gully, 3 – Ridge, 4 – Gentle Slope & 5 – Steep Slope.
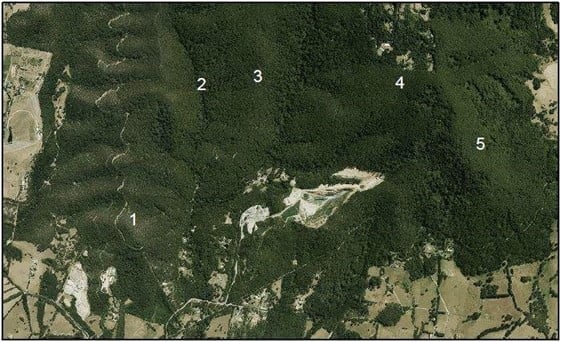
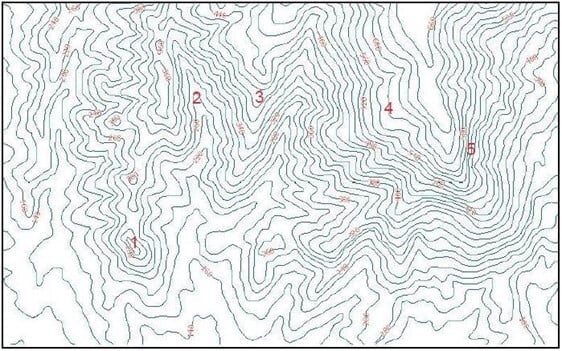

Figure 2: (a) Satellite Image of land surface , (b) Contour map showing how contour lines represent the landscape, (c) Satellite image of land surface shown with contour lines.
References
- Environment, Land, Water and Planning, Victoria 2020, VicPlan, viewed 4th January 2021, https://mapshare.vic.gov.au/vicplan/
- National Parks Association of NSW 2020, Interpreting map features, viewed 21st December 2020, http://www.bushwalking101.org/interpreting-map-features/
- Ordnance Survey 2020, A beginner’s guide to understanding map contour lines, viewed 21st December 2020, https://getoutside.ordnancesurvey.co.uk/guides/understanding-map-contour-lines-for-beginners/